Monday, April 24, 2006
How does he do it – Part II
Last year I used some information from a Venezuelan-American Chamber of Commerce (Vencham) presentation to explain why Chavez is so popular. That presentation showed, among other things, that the poorest Venezuelans had their incomes increase quite dramatically in 2004.
Now the same presentation has been given, but based on 2005 numbers. So lets take a look at how things have changed over the past year and how current economic trends might effect the political dynamic of the country
The first slide shows that this is a presentation on “Perspectives for the Market and Consumers” for 2006. The presentation is given by Datos, a long established Venezuelan data and polling firm and the forum is VenCham which has been consistently anti-Chavez. So rest assured, this is not data manipulated with a pro-Chavez bias in mind.
The next slide makes some general comments about the Venezuelan economy:
It goes as follows:
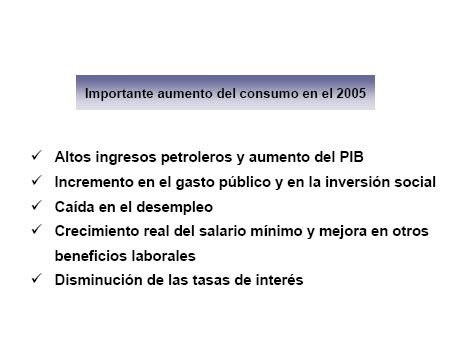
“Important increase in consumption in 2005
• High oil income and an increase in GDP
• Increase in social spending and social investment
• Decrease in unemployment
• Real increase in the minimum wage and improvements in other benefits
• Decrease in interest rates”
Nothing much new here. The economy grew over 9% in 2005 and all the economic indicators and trends, as described above, are positive. But this certainly is a dramatic reversal of fortune from when the economy was in a severe depression resulting largely from an opposition led oil strike.
Now how does this translate into changes in people’s standard of living? Here is an interesting slide that speaks to that:
This slide shows per capita consumption of non-perishable times (i.e., things like clothes, cars, appliances; not things like food, cleaning products) over the past decade and a half. You can see that consumption has gone up considerably – it is up 16% over 1998 (right before Chavez took power) and 5% over the recent peak of 1993. Note that consumption was lower in the years on the chart before 1993 so one would have to go back at least to the 80s and maybe even to the 70s to have higher per capita consumption of these durable goods. And of course, consumption is still increasing at a healthy clip – so one would be surprised if people weren’t happy with the economic situation in Venezuela.
This next table confirms that:
This chart gives the Index of Consumer Confidence – i.e. how well people think the economy is doing and will do in the near future. It presently stands at 93 and you have to go all the way back to 1988 to find a higher level of confidence. With such a high level of confidence in the economy you have to be pretty deluded to think the electorate would vote out an incumbent president.
Now that we can see that the economy overall seems to be doing quite well and most people feel good about it lets look a little at how individual segments of society are doing. First, we have this slide that shows the extent of Chavez’s social programs, the Missions:
The question posed to respondents in this slide is if they or anyone in their family have been beneficiaries of the Missions. Remember that the Missions include everything from the Mercal discount stores, to the Barrio Adentro health program, to various educational programs. On average about 57% of people said they had benefited from those programs. So they are reaching the majority of the population. The slide also breaks that statistic down by social class (for a definition of the social classes see here ). The middle and upper classes A,B and C+ actually had a fair participation in the Missions at 28%. The lower middle class, C-, had a participation rate of 32%. As expected the lower classes, D and E, had participation rates of 58% and 67% respectively. I am somewhat surprised those last two rates aren’t higher. I’m not sure why at least a third of all relatively poor people in Venezuela seem not to have any connection to the Missions. I would certainly hope this is a question being asked inside the government.
Lastly, we come to the most interesting slide, the one which shows income change over the past two years by social class:
First, it is a little disappointing the chart doesn’t give any information on how social classes A and B are doing so that we can make across the board comparisons for everyone. But even with what they do give we can note some interesting trends. First, class E, the poorest half of Venezuelan society (58% of the population actually) is doing remarkably well. In 2004 its income grew by 53% in nominal terms or by about 30% in real terms. That is a stunning increase. And though the economy as a whole grew by a very rapid 17% in 2004 the income of this segment increased by almost twice that amount. That would seem to show that Chavez’s social programs are having their intended effect of significantly boosting the income of Venezuela’s poorest. It has been said a number of times that although Chavez is rhetorically in favor of the poor he hasn’t done much to benefit them. These numbers should dispel that notion.
Moreover, the chart includes the 2004 vs. 2005 numbers and they show that the income of class E increased another 32% in nominal terms in 2005, or about 16% in real terms. Again, this is a very impressive increase and given that the economy as a whole grew by 9% it shows that it is Venezuela’s poor who are disproportionally benefiting from Venezuela’s boom
Now, if we look at the lower middle class, C- in the slide, we see that their income hasn’t even kept up with inflation for the past two years. That stands to reason as most of these people don’t participate in Chavez’s social programs as we previously saw. However, many of them have jobs in the formal sector and probably even work for the government. Given that earlier this year the government decreed some very large salary increases well above inflation this groups should do substantially better in 2006.
Finally we get to the one bit of negative news in the table – that of the income levels of class D. With their nominal income increases of 1% and 8% in the last two years they clearly saw their real income decline due to inflation. That is, in spite of Venezuela’s boom this group of people (23% of the population) has seen their standard of living drop over the past two years. Most of these people probably occupy the lower echelons of the formal labor market while a portion would work in the informal sector. But given that more than half of them do participate in the Missions it isn’t obvious why their income should have gone down. It would seem this is a group of people falling in the gap between the poorest who get the benefits of the social programs and those in a good enough position in the formal sector of the economy to command wage increases. Given that this is a quarter of the population this isn’t a situation that should be allowed to stand and hopefully modifications can be made to either wage scales or the Missions to help these people.
The anomaly of class D notwithstanding though what this presentation to the Venezuelan-American Chamber of Commerce showed was that Chavez’s strategy of using a booming economy to most benefit those who have historically had the least is working. Contrary to the opposition propaganda which paint his efforts as failures this shows they are being quite successful. Chavez and his government have good reason to be proud. And considering that the upper classes can hardly be said to be doing poorly maybe Chavez is on to something new here - trickle-up economics.
|
Now the same presentation has been given, but based on 2005 numbers. So lets take a look at how things have changed over the past year and how current economic trends might effect the political dynamic of the country
The first slide shows that this is a presentation on “Perspectives for the Market and Consumers” for 2006. The presentation is given by Datos, a long established Venezuelan data and polling firm and the forum is VenCham which has been consistently anti-Chavez. So rest assured, this is not data manipulated with a pro-Chavez bias in mind.
The next slide makes some general comments about the Venezuelan economy:
It goes as follows:
“Important increase in consumption in 2005
• High oil income and an increase in GDP
• Increase in social spending and social investment
• Decrease in unemployment
• Real increase in the minimum wage and improvements in other benefits
• Decrease in interest rates”
Nothing much new here. The economy grew over 9% in 2005 and all the economic indicators and trends, as described above, are positive. But this certainly is a dramatic reversal of fortune from when the economy was in a severe depression resulting largely from an opposition led oil strike.
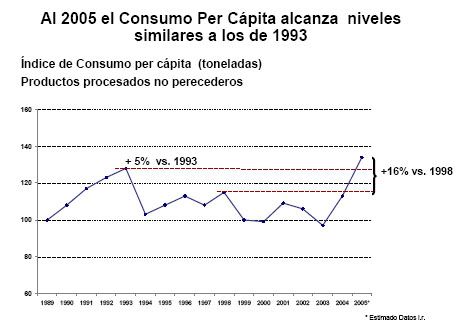
Now how does this translate into changes in people’s standard of living? Here is an interesting slide that speaks to that:
This slide shows per capita consumption of non-perishable times (i.e., things like clothes, cars, appliances; not things like food, cleaning products) over the past decade and a half. You can see that consumption has gone up considerably – it is up 16% over 1998 (right before Chavez took power) and 5% over the recent peak of 1993. Note that consumption was lower in the years on the chart before 1993 so one would have to go back at least to the 80s and maybe even to the 70s to have higher per capita consumption of these durable goods. And of course, consumption is still increasing at a healthy clip – so one would be surprised if people weren’t happy with the economic situation in Venezuela.
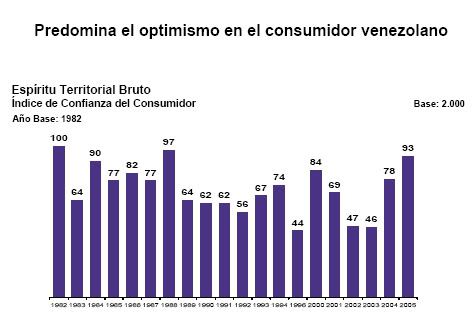
This next table confirms that:
This chart gives the Index of Consumer Confidence – i.e. how well people think the economy is doing and will do in the near future. It presently stands at 93 and you have to go all the way back to 1988 to find a higher level of confidence. With such a high level of confidence in the economy you have to be pretty deluded to think the electorate would vote out an incumbent president.
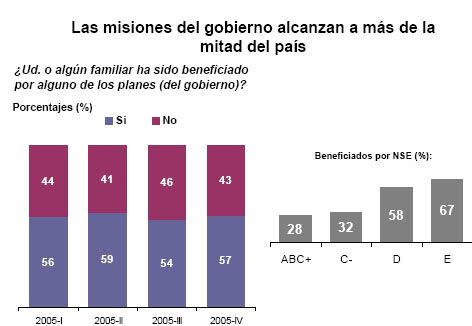
Now that we can see that the economy overall seems to be doing quite well and most people feel good about it lets look a little at how individual segments of society are doing. First, we have this slide that shows the extent of Chavez’s social programs, the Missions:
The question posed to respondents in this slide is if they or anyone in their family have been beneficiaries of the Missions. Remember that the Missions include everything from the Mercal discount stores, to the Barrio Adentro health program, to various educational programs. On average about 57% of people said they had benefited from those programs. So they are reaching the majority of the population. The slide also breaks that statistic down by social class (for a definition of the social classes see here ). The middle and upper classes A,B and C+ actually had a fair participation in the Missions at 28%. The lower middle class, C-, had a participation rate of 32%. As expected the lower classes, D and E, had participation rates of 58% and 67% respectively. I am somewhat surprised those last two rates aren’t higher. I’m not sure why at least a third of all relatively poor people in Venezuela seem not to have any connection to the Missions. I would certainly hope this is a question being asked inside the government.
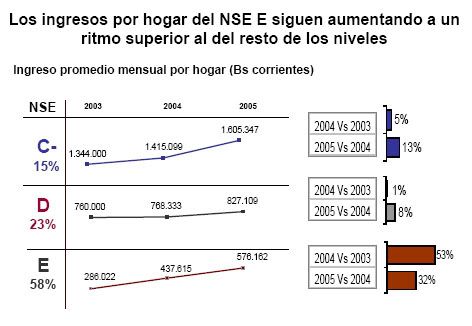
Lastly, we come to the most interesting slide, the one which shows income change over the past two years by social class:
First, it is a little disappointing the chart doesn’t give any information on how social classes A and B are doing so that we can make across the board comparisons for everyone. But even with what they do give we can note some interesting trends. First, class E, the poorest half of Venezuelan society (58% of the population actually) is doing remarkably well. In 2004 its income grew by 53% in nominal terms or by about 30% in real terms. That is a stunning increase. And though the economy as a whole grew by a very rapid 17% in 2004 the income of this segment increased by almost twice that amount. That would seem to show that Chavez’s social programs are having their intended effect of significantly boosting the income of Venezuela’s poorest. It has been said a number of times that although Chavez is rhetorically in favor of the poor he hasn’t done much to benefit them. These numbers should dispel that notion.
Moreover, the chart includes the 2004 vs. 2005 numbers and they show that the income of class E increased another 32% in nominal terms in 2005, or about 16% in real terms. Again, this is a very impressive increase and given that the economy as a whole grew by 9% it shows that it is Venezuela’s poor who are disproportionally benefiting from Venezuela’s boom
Now, if we look at the lower middle class, C- in the slide, we see that their income hasn’t even kept up with inflation for the past two years. That stands to reason as most of these people don’t participate in Chavez’s social programs as we previously saw. However, many of them have jobs in the formal sector and probably even work for the government. Given that earlier this year the government decreed some very large salary increases well above inflation this groups should do substantially better in 2006.
Finally we get to the one bit of negative news in the table – that of the income levels of class D. With their nominal income increases of 1% and 8% in the last two years they clearly saw their real income decline due to inflation. That is, in spite of Venezuela’s boom this group of people (23% of the population) has seen their standard of living drop over the past two years. Most of these people probably occupy the lower echelons of the formal labor market while a portion would work in the informal sector. But given that more than half of them do participate in the Missions it isn’t obvious why their income should have gone down. It would seem this is a group of people falling in the gap between the poorest who get the benefits of the social programs and those in a good enough position in the formal sector of the economy to command wage increases. Given that this is a quarter of the population this isn’t a situation that should be allowed to stand and hopefully modifications can be made to either wage scales or the Missions to help these people.
The anomaly of class D notwithstanding though what this presentation to the Venezuelan-American Chamber of Commerce showed was that Chavez’s strategy of using a booming economy to most benefit those who have historically had the least is working. Contrary to the opposition propaganda which paint his efforts as failures this shows they are being quite successful. Chavez and his government have good reason to be proud. And considering that the upper classes can hardly be said to be doing poorly maybe Chavez is on to something new here - trickle-up economics.
|
![]()
