Wednesday, July 15, 2009
The State of the Venezuelan Worker - 2008
Proceeding with the information from the Venezuelan Central Bank's report on the Venezuelan economy for 2008 I would now like to review some data on Venezuela's workforce and how its workers faired last year.
This data is quite interesting and thought provoking. And as usual, some of it paints the accomplishments of Hugo Chavez is a flattering light and some of it paints him in not such a flattering light.
Before getting into the pages that specifically relate to the Venezuelan workforce it is important to give a key statistic which is found at the bottom of this page:
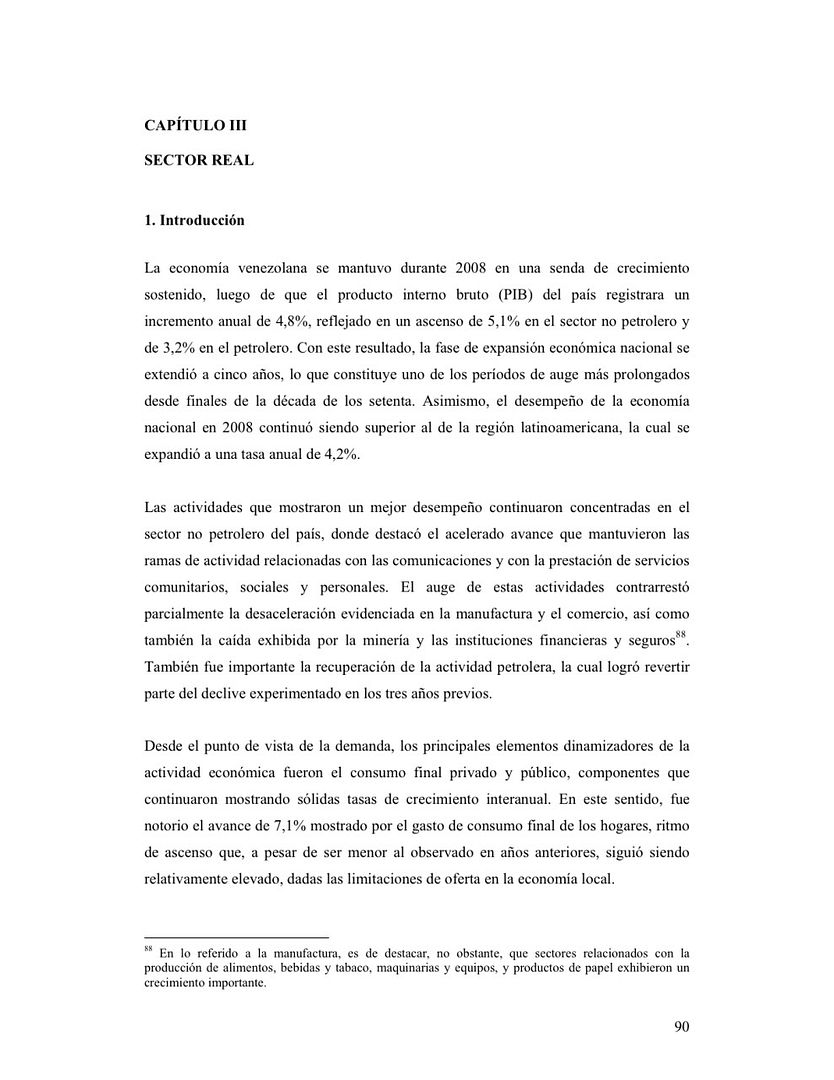
At the bottom of the page it notes that consumer spending in Venezuela went up by 7.1% last year. That is, Venezuelan households had 7.1% more money to spend last year, and spent it. In prior years this increase of spending had been upwards of 15%.
There is simply no overstating the significance of this - any country where peoples spending goes up by 7% in one year is going through an economic boom and 15% growth in consumer spending is almost beyond description. Want to see a true economic boom? - this is it.
And it is very obvious on the streets of Venezuela - all the new cars, the new shopping malls, the electronic gadgets everyone seems to have and on and on.
There is simply no disputing that the past number of years have been very good ones for the material well being of Venezuelans. However, what this means for your average Venezuelan worker is probably not what you would think and is an interesting subject that I'll get to later in the post.
On the next page we see some more important data on the Venezuelan work force.
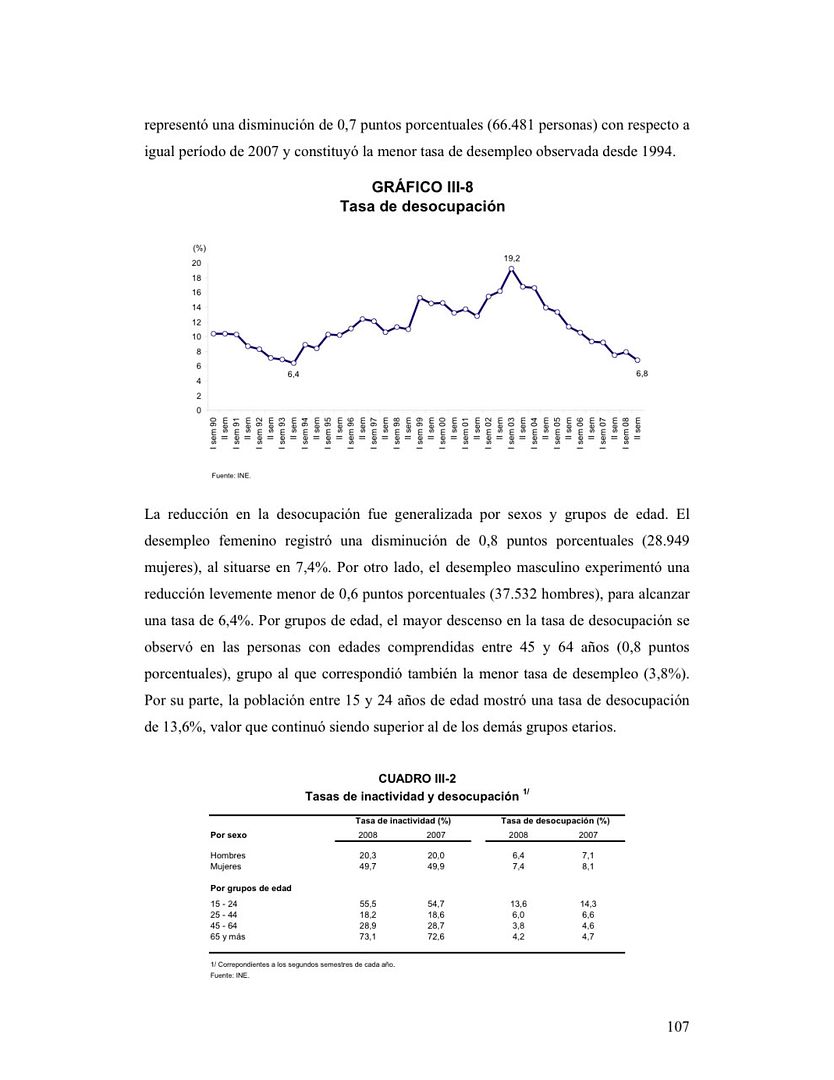
What we see here is the commonly known fact that unemployment has gone way down ever since the oil strike ended. From a high of 19% it is now down to less than 7%. To find a similarly low unemployment rate you have to go all the way back to the early 90s.
This is certainly good news for Venezuelan workers and it also helps explain how household spending went up. If more people in each household have jobs then there will be more money to spend.
On the next page we get some more details on the jobs that were created.
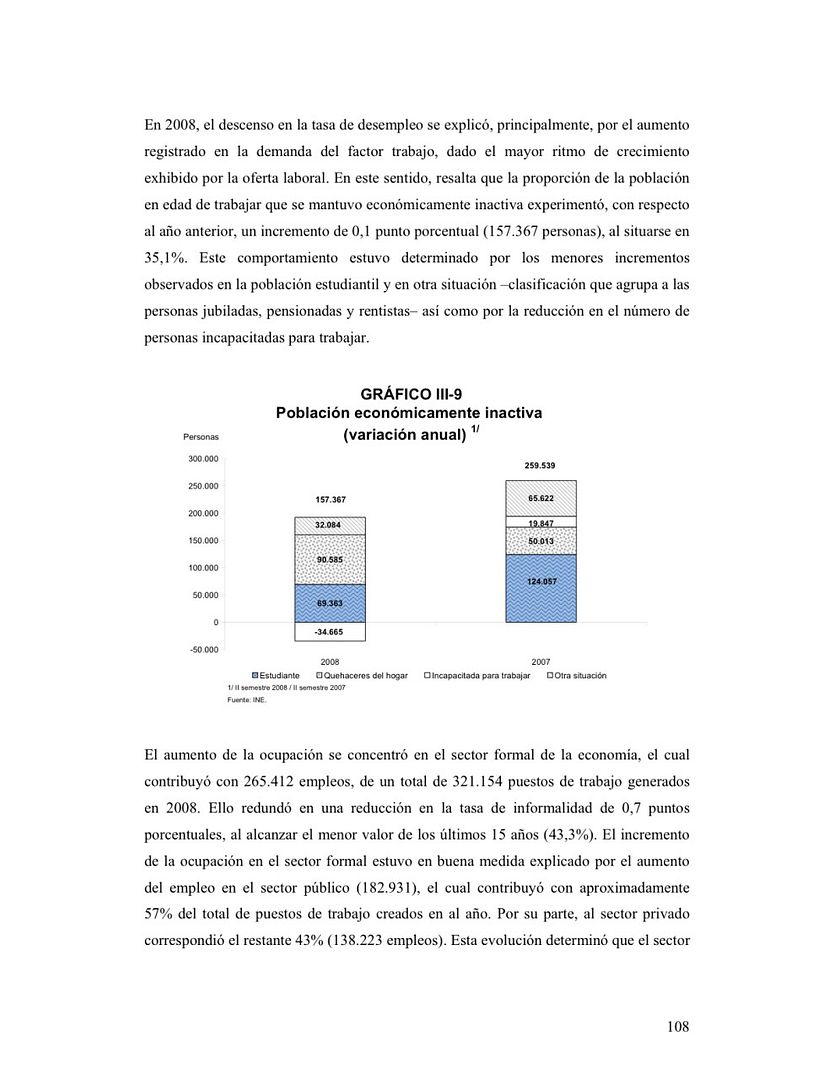
Last year year 321,154 jobs were created in Venezuela. That is a quite impressive number and is enough, even in a country with a young population like Venezuela, to absorb the hundreds of thousands of youth entering the job market each year.
Looking more closely, we can see that 265,412 of those jobs were created in the formal sector while 55,742 were created in the "informal" sector (which is often thought of, though not completely accurately, as being street vendors). So it is also good news that formal sector creation is leading the way.
Of those formal sector jobs 182,931 were government jobs with "only" 82,481 being formal private sector jobs (still a pretty good number by the way). So the job creation is VERY heavily tilted toward the government sector, not normally seen as something sustainable. Keep in mind, some of this probably results from private companies being bought by the government and hence those jobs now being considered government sector jobs.
Further, whether a job is private sector or public sector doesn't mean very much in and of itself. A private sector banking job doesn't necessarily do much to develop a countries economy. By way of contrast, a engineer working in a government run factory could do a lot to help the country. But more on this in a minute.
First, lets notice one warning sign that did appear on that page and that is that 157,000 people who are of working age dropped out of the work force. While no detailed analysis of that number is given that is generally not a good thing and can result from people finding it hard to get jobs.
In the next page we find a nice graph that shows how the formal and informal sectors of the workforce have changed in recent years:
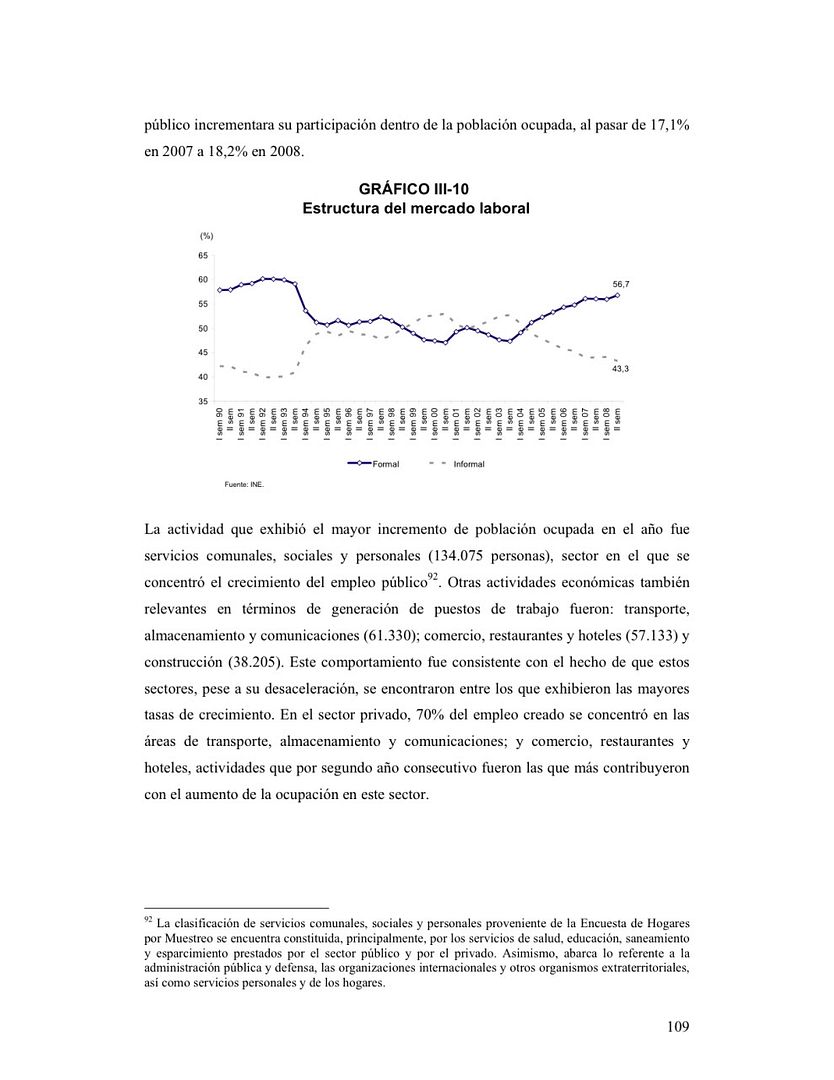
In the graph we see how in the mid 90s the informal sector of the workforce became almost as large, and sometimes larger, than the formal sector. This is not good because people in the informal sector generally do not have regular paychecks, are not paid as much, and are not entitled to benefits as people in the formal sector. Finally, in the oil boom of the past few years that negative trend was reversed with the formal sector growing and the informal sector shrinking. So that is another positive development.
Now, returning to the topic of all those jobs that have been created and whether or not they are productive we start to see numbers on the largest categories of jobs that were created. And they are...
Communal, personal, and social services: 134,075 jobs
Transport, communication and storage: 61,330 jobs
Commerce, restaurants, and hotels: 57,133 jobs
and
construction: 38,205 jobs
Well, we can clearly note what didn't make the list: manufacturing. In fact, neither did agriculture. Is a sustainable, robust, and healthy economy really built around teachers, cell phone sales people and hotel clerks, as important as those jobs may be? That is an important question that all Venezuelans should think about because unless those types of jobs truly are wealth creating Venezuela is in trouble.
Anyways, on the next page they give a nice graph showing job gains and losses by sector:
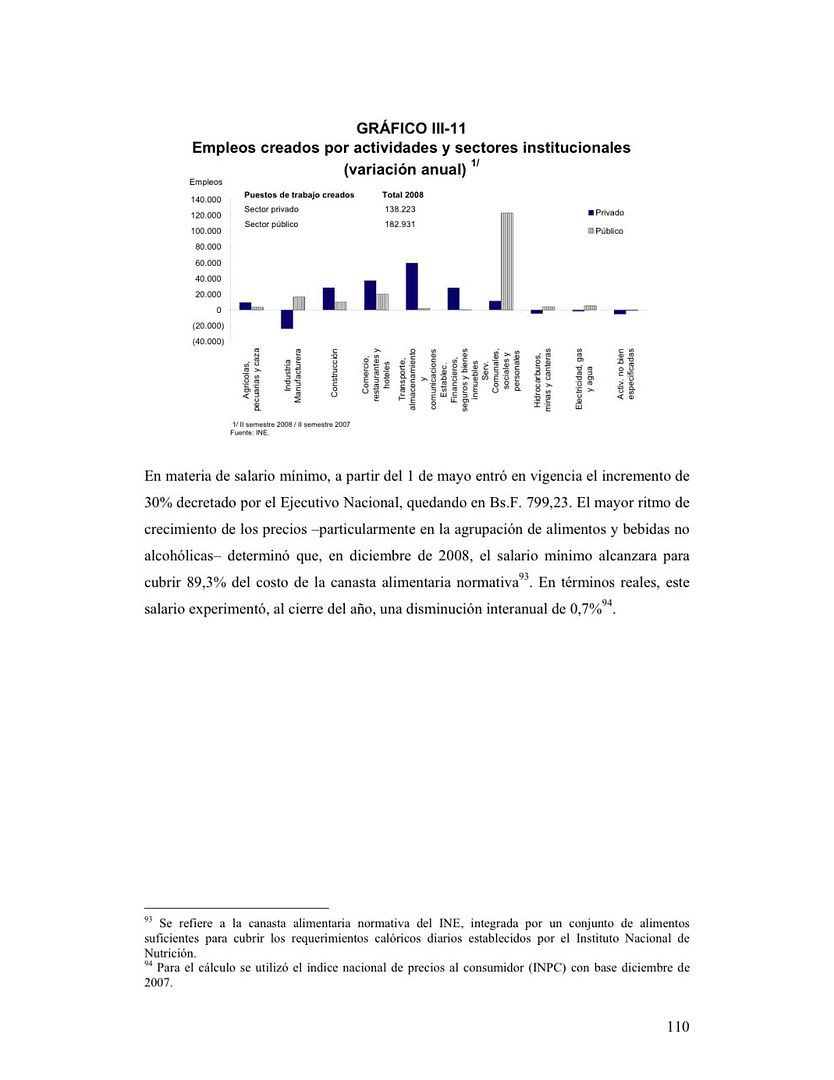
Note on the left hand side of the chart the two sectors with minimal job creating - agriculture and manufacturing.
So behind all the good job numbers, more jobs, more formal sector jobs, and higher family income, we already see one very ugly truth; most all of the job creation is in non-productive sectors of the economy which don't in and of themselves create much wealth. Looking at this it becomes pretty clear that most of the good news about the job market in Venezuela results from the oil boom and will only last as long as the oil boom does.
Now we come to the most interesting of the statistics regarding the Venezuelan workforce - wages. Of course, we all assume wages have gone way up. After all, the post started by pointing out that household spending was up by over 7% last year.
Further, we often see slides showing how things like the minimum wage have gone way up. Take these two slides for instance:
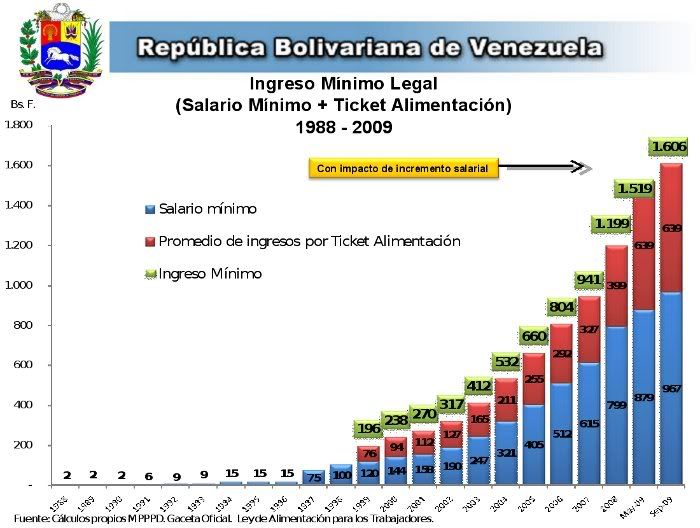
In this slide we can see that the minimum wage in Venezuela has gone way up, almost exponentially it would seem.
However, those who know what inflation is like will know this is not all it seems and want to see something that would show more what the true value of the minimum wage is.
Keeping that in mind we next see this:
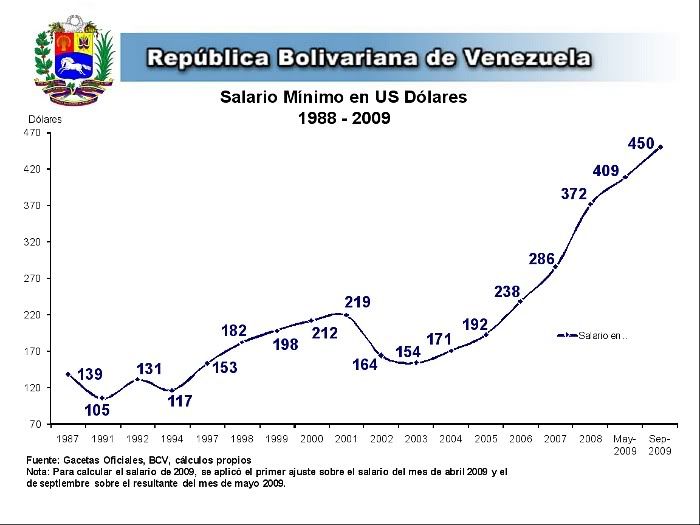
This chart shows the Venezuelan minimum wage in dollar terms. The government particularly favors this chart as it makes it look like Venezuelan workers have more than doubled their income under Chavez - after all, they are earning more than twice as many dollars and that is generally taken as a consistent frame of reference.
But in reality that is just another trick. Venezuelans don't spend in dollars, they spend in Bolivares and Bolivares are worth less and less each year because of high inflation. But they do hold their value against one thing - the dollar. That is because of an exchange rate that is controlled by the government and has been fixed for many years.
So if you look at the purchasing power of the Venezuelan minimum wage in dollars, and this is quite ironic as Venezuelan minimum wage workers could never get their hands on dollars at the official exchange rate, it looks like their wages have gone way up. But in reality, this is an illusion created by a fixed and overvalued exchange rate.
So how can we see how minimum wage workers, and keep in mind many (most?) workers in Venezuela earn the minimum wage, have done during the oil boom? Easy. The economists at the Venezuelan Central Bank have created a graph that shows very nicely illustrates how they have done.
It is on this page:
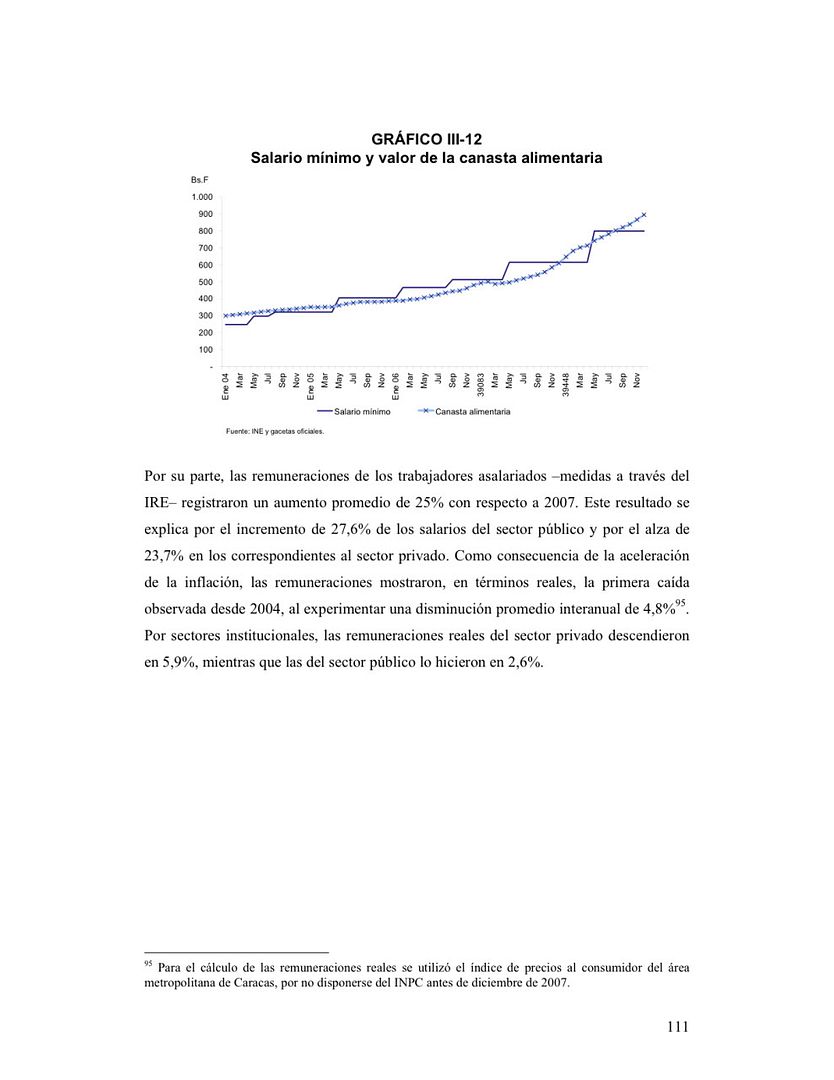
On this chart we see plotted, from 2004 to the end of 2008, the minimum wage (the plain line) versus the "food basket" (the line of with xs) which is how much it costs to buy the food one needs to eat properly.
Lets look carefully. In 2004 the minimum was not quite enough to put food on the table as the minimum wage was slightly below the cost of the food basket. Fast forward 5 years through a huge oil boom and the minimum wage is... still not quite enough to put food on the table as it is still below the food basket. Wow. A big wow. A really, really big wow.
This is an absolutely stunning fact!! In spite what the propaganda slides that are for public consumption show the reality is minimum wage workers in Venezuela have not seen their earning power go up in the past five years in spite of the huge boom going on around them!!!!!
And it gets worse. Read the text below the graph and you will learn that the average wage in Venezuela fell by 4.8% (and you have to keep reminding yourself this was in a year when oil hit an all time high!) in real terms with public sector wages down by 2.6% and private sector wages down by 5.9%.
To sum this up, anyone in Venezuela who actually works for a living and depends solely on their wages already started seeing their standard of living drop significantly in 2008. No wonder there have been so many strikes in Venezuela!!
To conclude, we need to think about one thing. We've seen two seemingly very contradictory statistics here. The first is that household spending has gone up 7.1%. The second is that real wages are dropping significantly. How can this be? Unfortunately, the authors of the report don't really attempt to explain it.
Here is my best estimation of what explains it:
1) More Venezuelans have jobs so that even if wages from every individual job has gone down overall family income has gone up due to more people in an average family having jobs.
2) Some Venezuelans make their living from owning their own businesses. And if their profits have gone way up then they could be earning and spending more. While this would be a small group the money they earn could be enough to skew the statistics
3) Finally, and I think the most probable explanation, is that the government has increasingly given people non-wage income. University scholarships, grants for homemakers, Mission stipends, etc, etc have proliferated under Chavez and probably put a very significant amount of money in many people's pockets. Further, pensions have been greatly expanded and their amounts increased too.
Taking into account those points the seeming contradiction can easily be understood - Venezuelans have a lot more money to spend while at the same time they actually earn less from working.
The big question is - is this a good thing and is this the way a society trying to develop and become self-reliant should really be doing things?
Something to think about as you look at the state of Venezuelan workers in 2008.
|
This data is quite interesting and thought provoking. And as usual, some of it paints the accomplishments of Hugo Chavez is a flattering light and some of it paints him in not such a flattering light.
Before getting into the pages that specifically relate to the Venezuelan workforce it is important to give a key statistic which is found at the bottom of this page:
At the bottom of the page it notes that consumer spending in Venezuela went up by 7.1% last year. That is, Venezuelan households had 7.1% more money to spend last year, and spent it. In prior years this increase of spending had been upwards of 15%.
There is simply no overstating the significance of this - any country where peoples spending goes up by 7% in one year is going through an economic boom and 15% growth in consumer spending is almost beyond description. Want to see a true economic boom? - this is it.
And it is very obvious on the streets of Venezuela - all the new cars, the new shopping malls, the electronic gadgets everyone seems to have and on and on.
There is simply no disputing that the past number of years have been very good ones for the material well being of Venezuelans. However, what this means for your average Venezuelan worker is probably not what you would think and is an interesting subject that I'll get to later in the post.
On the next page we see some more important data on the Venezuelan work force.
What we see here is the commonly known fact that unemployment has gone way down ever since the oil strike ended. From a high of 19% it is now down to less than 7%. To find a similarly low unemployment rate you have to go all the way back to the early 90s.
This is certainly good news for Venezuelan workers and it also helps explain how household spending went up. If more people in each household have jobs then there will be more money to spend.
On the next page we get some more details on the jobs that were created.
Last year year 321,154 jobs were created in Venezuela. That is a quite impressive number and is enough, even in a country with a young population like Venezuela, to absorb the hundreds of thousands of youth entering the job market each year.
Looking more closely, we can see that 265,412 of those jobs were created in the formal sector while 55,742 were created in the "informal" sector (which is often thought of, though not completely accurately, as being street vendors). So it is also good news that formal sector creation is leading the way.
Of those formal sector jobs 182,931 were government jobs with "only" 82,481 being formal private sector jobs (still a pretty good number by the way). So the job creation is VERY heavily tilted toward the government sector, not normally seen as something sustainable. Keep in mind, some of this probably results from private companies being bought by the government and hence those jobs now being considered government sector jobs.
Further, whether a job is private sector or public sector doesn't mean very much in and of itself. A private sector banking job doesn't necessarily do much to develop a countries economy. By way of contrast, a engineer working in a government run factory could do a lot to help the country. But more on this in a minute.
First, lets notice one warning sign that did appear on that page and that is that 157,000 people who are of working age dropped out of the work force. While no detailed analysis of that number is given that is generally not a good thing and can result from people finding it hard to get jobs.
In the next page we find a nice graph that shows how the formal and informal sectors of the workforce have changed in recent years:
In the graph we see how in the mid 90s the informal sector of the workforce became almost as large, and sometimes larger, than the formal sector. This is not good because people in the informal sector generally do not have regular paychecks, are not paid as much, and are not entitled to benefits as people in the formal sector. Finally, in the oil boom of the past few years that negative trend was reversed with the formal sector growing and the informal sector shrinking. So that is another positive development.
Now, returning to the topic of all those jobs that have been created and whether or not they are productive we start to see numbers on the largest categories of jobs that were created. And they are...
Communal, personal, and social services: 134,075 jobs
Transport, communication and storage: 61,330 jobs
Commerce, restaurants, and hotels: 57,133 jobs
and
construction: 38,205 jobs
Well, we can clearly note what didn't make the list: manufacturing. In fact, neither did agriculture. Is a sustainable, robust, and healthy economy really built around teachers, cell phone sales people and hotel clerks, as important as those jobs may be? That is an important question that all Venezuelans should think about because unless those types of jobs truly are wealth creating Venezuela is in trouble.
Anyways, on the next page they give a nice graph showing job gains and losses by sector:
Note on the left hand side of the chart the two sectors with minimal job creating - agriculture and manufacturing.
So behind all the good job numbers, more jobs, more formal sector jobs, and higher family income, we already see one very ugly truth; most all of the job creation is in non-productive sectors of the economy which don't in and of themselves create much wealth. Looking at this it becomes pretty clear that most of the good news about the job market in Venezuela results from the oil boom and will only last as long as the oil boom does.
Now we come to the most interesting of the statistics regarding the Venezuelan workforce - wages. Of course, we all assume wages have gone way up. After all, the post started by pointing out that household spending was up by over 7% last year.
Further, we often see slides showing how things like the minimum wage have gone way up. Take these two slides for instance:
In this slide we can see that the minimum wage in Venezuela has gone way up, almost exponentially it would seem.
However, those who know what inflation is like will know this is not all it seems and want to see something that would show more what the true value of the minimum wage is.
Keeping that in mind we next see this:
This chart shows the Venezuelan minimum wage in dollar terms. The government particularly favors this chart as it makes it look like Venezuelan workers have more than doubled their income under Chavez - after all, they are earning more than twice as many dollars and that is generally taken as a consistent frame of reference.
But in reality that is just another trick. Venezuelans don't spend in dollars, they spend in Bolivares and Bolivares are worth less and less each year because of high inflation. But they do hold their value against one thing - the dollar. That is because of an exchange rate that is controlled by the government and has been fixed for many years.
So if you look at the purchasing power of the Venezuelan minimum wage in dollars, and this is quite ironic as Venezuelan minimum wage workers could never get their hands on dollars at the official exchange rate, it looks like their wages have gone way up. But in reality, this is an illusion created by a fixed and overvalued exchange rate.
So how can we see how minimum wage workers, and keep in mind many (most?) workers in Venezuela earn the minimum wage, have done during the oil boom? Easy. The economists at the Venezuelan Central Bank have created a graph that shows very nicely illustrates how they have done.
It is on this page:
On this chart we see plotted, from 2004 to the end of 2008, the minimum wage (the plain line) versus the "food basket" (the line of with xs) which is how much it costs to buy the food one needs to eat properly.
Lets look carefully. In 2004 the minimum was not quite enough to put food on the table as the minimum wage was slightly below the cost of the food basket. Fast forward 5 years through a huge oil boom and the minimum wage is... still not quite enough to put food on the table as it is still below the food basket. Wow. A big wow. A really, really big wow.
This is an absolutely stunning fact!! In spite what the propaganda slides that are for public consumption show the reality is minimum wage workers in Venezuela have not seen their earning power go up in the past five years in spite of the huge boom going on around them!!!!!
And it gets worse. Read the text below the graph and you will learn that the average wage in Venezuela fell by 4.8% (and you have to keep reminding yourself this was in a year when oil hit an all time high!) in real terms with public sector wages down by 2.6% and private sector wages down by 5.9%.
To sum this up, anyone in Venezuela who actually works for a living and depends solely on their wages already started seeing their standard of living drop significantly in 2008. No wonder there have been so many strikes in Venezuela!!
To conclude, we need to think about one thing. We've seen two seemingly very contradictory statistics here. The first is that household spending has gone up 7.1%. The second is that real wages are dropping significantly. How can this be? Unfortunately, the authors of the report don't really attempt to explain it.
Here is my best estimation of what explains it:
1) More Venezuelans have jobs so that even if wages from every individual job has gone down overall family income has gone up due to more people in an average family having jobs.
2) Some Venezuelans make their living from owning their own businesses. And if their profits have gone way up then they could be earning and spending more. While this would be a small group the money they earn could be enough to skew the statistics
3) Finally, and I think the most probable explanation, is that the government has increasingly given people non-wage income. University scholarships, grants for homemakers, Mission stipends, etc, etc have proliferated under Chavez and probably put a very significant amount of money in many people's pockets. Further, pensions have been greatly expanded and their amounts increased too.
Taking into account those points the seeming contradiction can easily be understood - Venezuelans have a lot more money to spend while at the same time they actually earn less from working.
The big question is - is this a good thing and is this the way a society trying to develop and become self-reliant should really be doing things?
Something to think about as you look at the state of Venezuelan workers in 2008.
|
Monday, July 13, 2009
The state of Venezuelan manufacturing - 2008
As I have mentioned, the Venezuelan Central Bank has finally come out with the 2008 version of its excellent annual economic summary. It can be found here and it REALLY should be read by all who can read Spanish.
However, recognizing that many either can't read it or won't read it for lack of time I will try to summarize some of the key points that will help provide the best understanding of both the strengths and weaknesses of the Venezuelan economy.
In this post I will touch on Venezuela's manufacturing sector.
It is well known that the manufacturing sector of the Venezuelan economy has not been doing well. During most of the oil boom it has grown well below the rate of most of the rest of the non-oil sector. Further, even while oil revenues were peaking in the middle of last year it went into decline and actually contracted in both the third and fourth quarter. And of course, the first quarter of this year saw manufacturing only decline still more.
However, the Central Bank Report gave some very illuminating information with regard to manufacturing that gives both more historical perspective and more depth than just the latest quarterly GDP statistics. So with out further ado here is the first extract from the report:
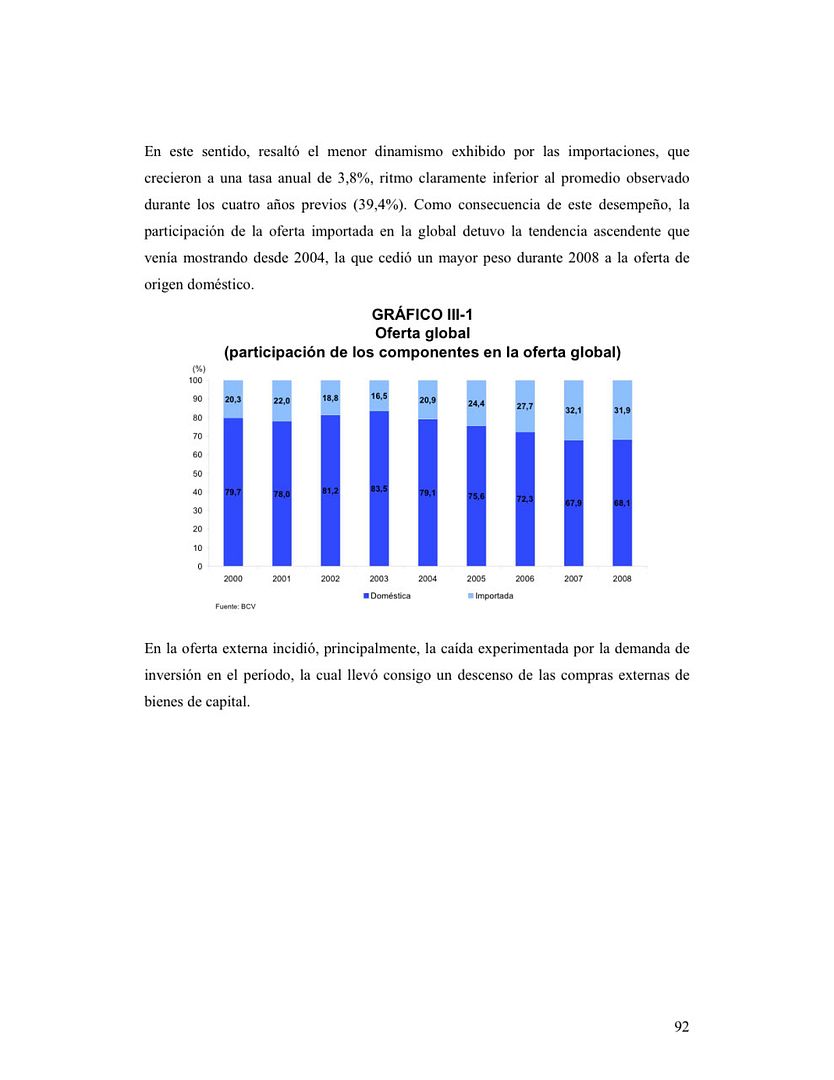
Now much has been made on this blog about Venezuela's policies on industrialization or lack thereof. I have long maintained that Venezuela has just been riding an oil boom and has done little to create industry. Others have claimed they are following an import substitution industrialization policy.
Well, to help exam which of those claims is nearer to the truth maybe we should look at the above graph which shows what percentage of internal consumption is satisfied by local production and what percentage is satisfied by imports.
Sad to say, it doesn't look good for the import substitution cause. Looking from 2004 to 2008 we see a steady upward march of IMPORTS with their percentage of total supply going from 21% to almost 32%.
That is, a significantly higher portion of the goods consumed in Venezuela today come from imports and a significantly lower portion of goods are produced domestically. In other words, we are seeing the exact OPPOSITE of import substitution in Venezuela.
Now, you could look at 2008, note that the upward trend of imports seemed to stop that year, and conclude "hey, maybe they finally are starting to produce more locally".
Sadly we know that isn't true because manufacturing GDP in 2008 stopped dead in its tracks.
But even worse if you read the sentence immediately below the graph you can see why imports stopped rising - investment in Venezuela dropped significantly and so the importation of capital goods fell significantly. In laymen's terms, in 2008 they kept importing flat screen TVs but cut way back on machinery to be used in factories. Not exactly a winning industrialization strategy.
The next slide begins a highly informative sub-section of the report dedicated to analyzing manufacturing:
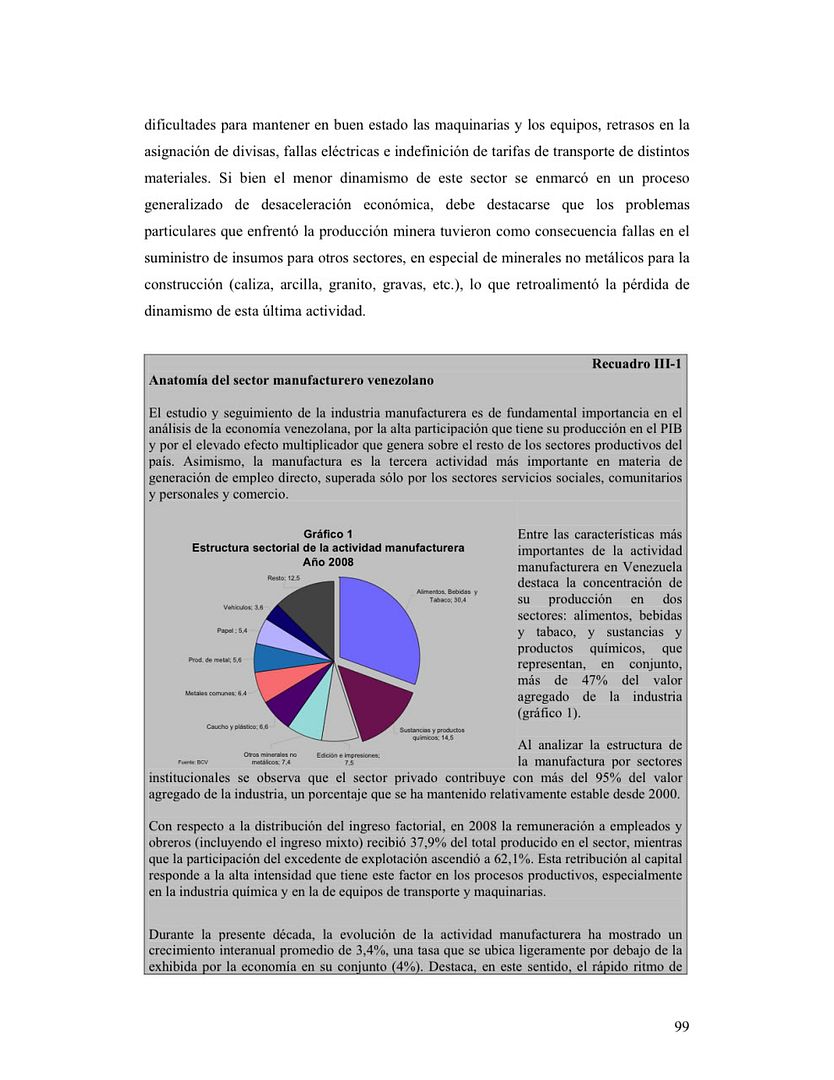
The first graph is very interesting as it gives a break down of manufacturing by sector. It is illuminating.
I can remember the days when I was happy that Venezuelan manufacturing was growing fairly rapidly and someone would say to me - "Get a grip O.W., the only thing Venezuela makes is beer". Turns out, they were right. Far and away the main segment of Venezuelan manufacturing is food and beverages which accounts for practically a third of Venezuelan "industrial" output.
Newspapers and printing account for another 7.5%. More serious industry such as automobiles are practically at the bottom of the heap.
This graph certainly doesn't serve to make Venezuelan "industry" look very impressive.
Also, a very important point should be noted in the text of this page. It points out that in terms of value added by manufacturing a whopping 95% of manufacturing is by the private sector!!!! It further points out that this stunning number has held steady since 2000.
Factoids like that probably explain why neither Francisco Toro nor Mark Weisbrot want to read this report, much less comment on it. Francisco's standard line of the Castroite Venezuelan government is taking over the whole economy is obviously total bullshit when 95% of one of its most important sectors is still in private hands. And the notion that the Venezuelan government is leading any sort of industrialization drive, as people like Weisbrot like to contend, is down right silly when the government segment of manufacturing is only 5% and it isn't even growing!!!
On the next page this sub-section continues:
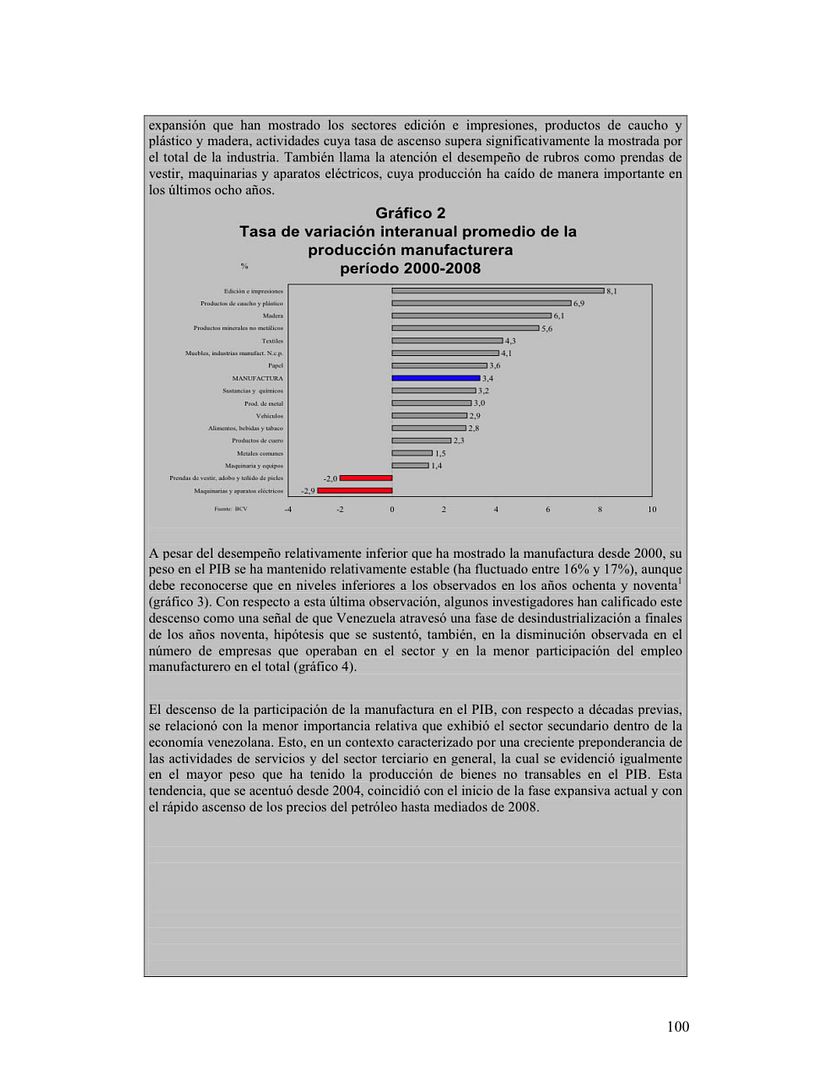
In the graph on this page we see the relative performance of the different manufacturing sectors over the past eight years. Very interestingly, the strongest performing sector by far is printing and publishing. Hey, I guess all the propaganda newspapers and pamphlets did lead to a boom of sorts!!
Sadly, the manufacture of some more important items didn't do quite so well. The manufacture of machinery grew at a paltry 1.4% percent rate while electronic equipment outright declined. I wouldn't think that would be happening if the country was actually industrializing.
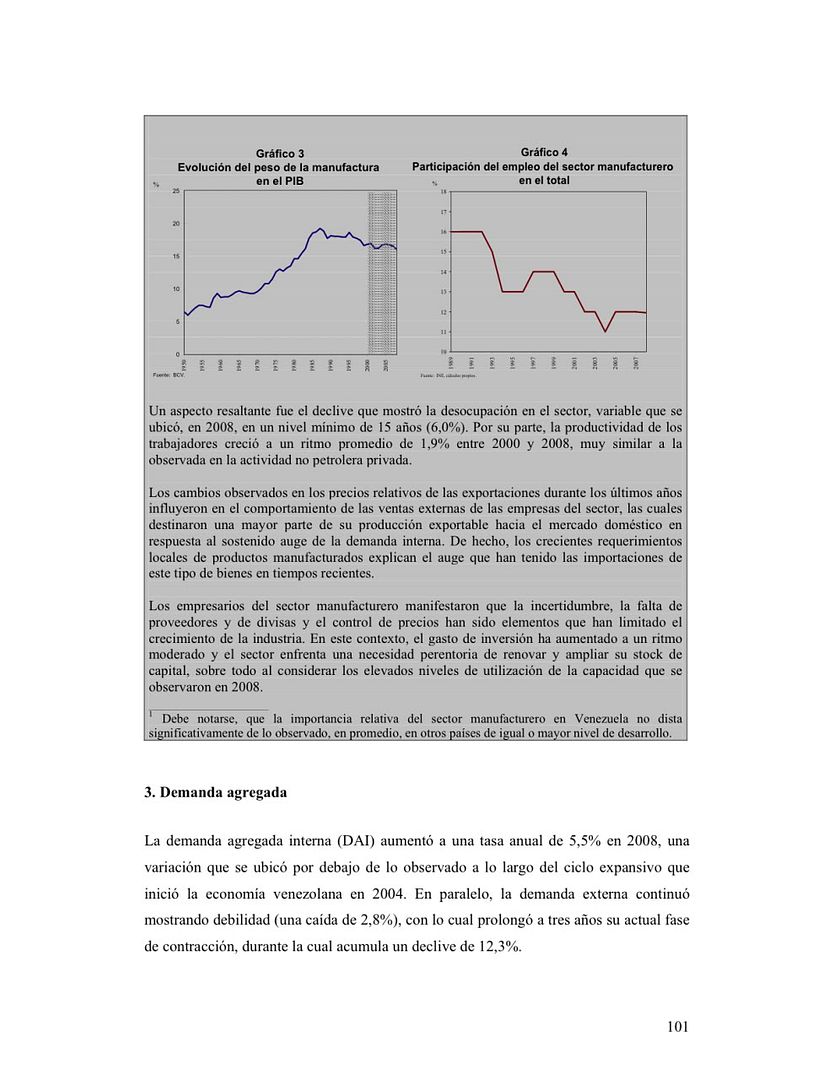
Next comes the page with the last part of the sub-section on manufacturing. This contains what is actually one of the most revealing graphs.
The graph on the left shows manufacturing GDP as a percentage of total GDP for Venezuela. The shaded part of the graph corresponds to the period of Chavez's presidency. Note that during that period manufacturing has remained constant relative to overall GDP. Now, that means manufacturing has grown quite a bit as the Venezuelan economy overall as grown a lot.
But note something even more interesting. During the much maligned 70s and 80s manufacturing actually grew much more rapidly as it became an ever larger share of GDP.
That is something you would expect to see in a country that is actually trying to industrialize. Yet we see it under Carlos Andres Perez and Luis Campins, not under Hugo Chavez. The believers in the infallibility of Chavez should have fun trying to explain that one away.
In sum, we have known for quite some time that manufacturing in Venezuela wasn't doing well in the current oil boom. Yet we have now picked up some even scarier details - imports make up an increasing portion of Venezuelan consumption, Venezuelan industry is almost entirely in private hands, Venezuelan industry, such as it is, his heavily comprised of "light" industry, the segments of industry that would be helpful for investment are precisely the slowest growing ones, and the 70s and 80s seemed to show a much better performance by the manufacturing sector than has the Chavez era.
Sorry to all those who don't like the above - but that's just the facts as presented by the Central Bank of Venezuela.
And just as a final point, it should be noted that the Venezuelan government doesn't publish bogus statistics. There is absolutely no indication that they do anything of the sort. Rather, they publish an honest and frank listing of the facts with apparently little concern for whose ox those facts might gore. The real question is how many Venezuelans are interested in reading an honest account of the facts. It would appear, not many.
|
However, recognizing that many either can't read it or won't read it for lack of time I will try to summarize some of the key points that will help provide the best understanding of both the strengths and weaknesses of the Venezuelan economy.
In this post I will touch on Venezuela's manufacturing sector.
It is well known that the manufacturing sector of the Venezuelan economy has not been doing well. During most of the oil boom it has grown well below the rate of most of the rest of the non-oil sector. Further, even while oil revenues were peaking in the middle of last year it went into decline and actually contracted in both the third and fourth quarter. And of course, the first quarter of this year saw manufacturing only decline still more.
However, the Central Bank Report gave some very illuminating information with regard to manufacturing that gives both more historical perspective and more depth than just the latest quarterly GDP statistics. So with out further ado here is the first extract from the report:
Now much has been made on this blog about Venezuela's policies on industrialization or lack thereof. I have long maintained that Venezuela has just been riding an oil boom and has done little to create industry. Others have claimed they are following an import substitution industrialization policy.
Well, to help exam which of those claims is nearer to the truth maybe we should look at the above graph which shows what percentage of internal consumption is satisfied by local production and what percentage is satisfied by imports.
Sad to say, it doesn't look good for the import substitution cause. Looking from 2004 to 2008 we see a steady upward march of IMPORTS with their percentage of total supply going from 21% to almost 32%.
That is, a significantly higher portion of the goods consumed in Venezuela today come from imports and a significantly lower portion of goods are produced domestically. In other words, we are seeing the exact OPPOSITE of import substitution in Venezuela.
Now, you could look at 2008, note that the upward trend of imports seemed to stop that year, and conclude "hey, maybe they finally are starting to produce more locally".
Sadly we know that isn't true because manufacturing GDP in 2008 stopped dead in its tracks.
But even worse if you read the sentence immediately below the graph you can see why imports stopped rising - investment in Venezuela dropped significantly and so the importation of capital goods fell significantly. In laymen's terms, in 2008 they kept importing flat screen TVs but cut way back on machinery to be used in factories. Not exactly a winning industrialization strategy.
The next slide begins a highly informative sub-section of the report dedicated to analyzing manufacturing:
The first graph is very interesting as it gives a break down of manufacturing by sector. It is illuminating.
I can remember the days when I was happy that Venezuelan manufacturing was growing fairly rapidly and someone would say to me - "Get a grip O.W., the only thing Venezuela makes is beer". Turns out, they were right. Far and away the main segment of Venezuelan manufacturing is food and beverages which accounts for practically a third of Venezuelan "industrial" output.
Newspapers and printing account for another 7.5%. More serious industry such as automobiles are practically at the bottom of the heap.
This graph certainly doesn't serve to make Venezuelan "industry" look very impressive.
Also, a very important point should be noted in the text of this page. It points out that in terms of value added by manufacturing a whopping 95% of manufacturing is by the private sector!!!! It further points out that this stunning number has held steady since 2000.
Factoids like that probably explain why neither Francisco Toro nor Mark Weisbrot want to read this report, much less comment on it. Francisco's standard line of the Castroite Venezuelan government is taking over the whole economy is obviously total bullshit when 95% of one of its most important sectors is still in private hands. And the notion that the Venezuelan government is leading any sort of industrialization drive, as people like Weisbrot like to contend, is down right silly when the government segment of manufacturing is only 5% and it isn't even growing!!!
On the next page this sub-section continues:
In the graph on this page we see the relative performance of the different manufacturing sectors over the past eight years. Very interestingly, the strongest performing sector by far is printing and publishing. Hey, I guess all the propaganda newspapers and pamphlets did lead to a boom of sorts!!
Sadly, the manufacture of some more important items didn't do quite so well. The manufacture of machinery grew at a paltry 1.4% percent rate while electronic equipment outright declined. I wouldn't think that would be happening if the country was actually industrializing.
Next comes the page with the last part of the sub-section on manufacturing. This contains what is actually one of the most revealing graphs.
The graph on the left shows manufacturing GDP as a percentage of total GDP for Venezuela. The shaded part of the graph corresponds to the period of Chavez's presidency. Note that during that period manufacturing has remained constant relative to overall GDP. Now, that means manufacturing has grown quite a bit as the Venezuelan economy overall as grown a lot.
But note something even more interesting. During the much maligned 70s and 80s manufacturing actually grew much more rapidly as it became an ever larger share of GDP.
That is something you would expect to see in a country that is actually trying to industrialize. Yet we see it under Carlos Andres Perez and Luis Campins, not under Hugo Chavez. The believers in the infallibility of Chavez should have fun trying to explain that one away.
In sum, we have known for quite some time that manufacturing in Venezuela wasn't doing well in the current oil boom. Yet we have now picked up some even scarier details - imports make up an increasing portion of Venezuelan consumption, Venezuelan industry is almost entirely in private hands, Venezuelan industry, such as it is, his heavily comprised of "light" industry, the segments of industry that would be helpful for investment are precisely the slowest growing ones, and the 70s and 80s seemed to show a much better performance by the manufacturing sector than has the Chavez era.
Sorry to all those who don't like the above - but that's just the facts as presented by the Central Bank of Venezuela.
And just as a final point, it should be noted that the Venezuelan government doesn't publish bogus statistics. There is absolutely no indication that they do anything of the sort. Rather, they publish an honest and frank listing of the facts with apparently little concern for whose ox those facts might gore. The real question is how many Venezuelans are interested in reading an honest account of the facts. It would appear, not many.
|
![]()
